Slow performance has a direct impact on your user experience and bottom line — and third-party scripts are a frequent cause.
Start with a Simple Audit
A simple audit is the best starting point for addressing performance problems. In fact, you may find active scripts and plugins that you can immediately delete to improve performance! The remaining scripts should be carefully vetted to see if they're causing any performance issues.
Chrome or FireFox Developer Tools provide an easy way to generate a list of scripts on a given web page, plus tell you which have the biggest impact on performance.
There are a few steps to track down bulky scripts:
- Open a Window in your browser.
- Go to the web page you want to test.
- Right-click and select Inspect to open Developer Tools
- Go to the Performance tab.
- Click the Reload button in the upper-left corner.
- Wait for the page to finish loading.
- Click on the Bottom-Up tab.
- Select the Group by Product option in the dropdown.
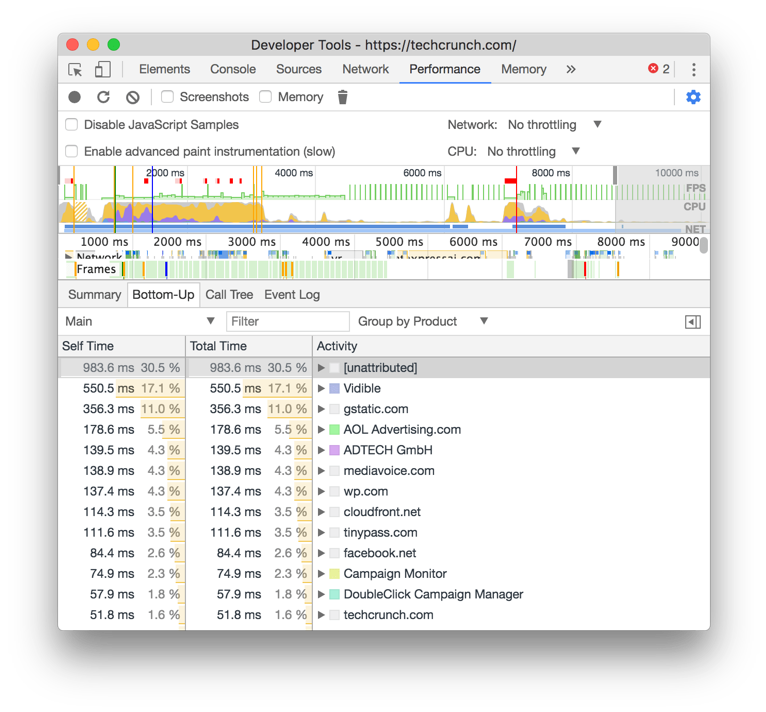
Chrome Developer Tools's Bottom-Up Performance Profile – Source: Google
You may have to run the test a few times just to confirm some scripts weren't experiencing temporary issues, but you’ll get a clear picture of what scripts are causing roadblocks. If you want to compare loading times without certain scripts, right-click on them and select “Block Request Domain.” This will prevent the script from loading in your browser.
It’s a good idea to evaluate each of these scripts to see if they’re really necessary. You can explore alternative options to accomplish the same goals with less of a performance impact. For instance, you might ask yourself if the added loading time is worth the potential cost to conversion rates, knowing that each second could translate to a 7% drop.
Update Your Load Testing
The best way to ensure optimal performance over time is to incorporate load tests into your development processes. Before each deploy, run a test to ensure that if a new third-party script or app functionality degrades performance.
The problem with many load tests is that they fail to account for scripts and plugins since they run requests at the protocol level. For example, say JMeter sends a GET request to see how long it takes to receive the HTML response. None of the JavaScript (or CSS) is executed within the response, so the final performance metrics don't incorporate their impact on load time.
Browser-based load tests provide a more complete picture. They spin up actual browsers in the cloud and measure the full response. While these tests have been prohibitively expensive to scale in the past, tools like LoadNinja make it possible to run tens of thousands of real browser-based requests and analyze their performance.
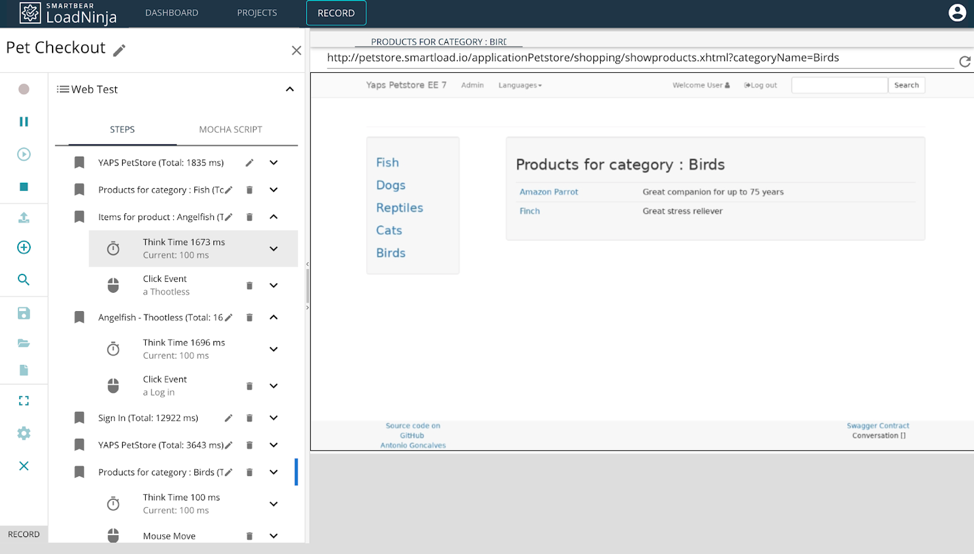
LoadNinja's InstaPlay Recorder – Source: LoadNinja
LoadNinja provides several advantages over both protocol-based load test frameworks and other browser-based tools:
- Easier Debugging: Developers and test engineers can dive into each virtual user session and debug the problem from the browser's DOM. It's much easier to find problems within a real browser session than trying to debug a request that's slowing down for an unknown reason.
InstaPlay Recorder: Create test scripts in minutes rather than hours. There's no need to code or dynamically correlate sessions or cookies – even with complex transactions. You simply hit 'record' and do a task as a user would, then see the impact on performance.
- Real Browsers: Generate a realistic load using tens of thousands of real browsers that accurately represent your end users. From these sessions, you can evaluate navigation timing and other browser-based metrics. It gives you a lot more insight than possible with protocol tests.
Sign up for a free trial
Get started with LoadNinja today!
Keep Your Page Lean and Fast
It's impossible to avoid third-party scripts altogether in today's world, but there are steps you can take to ensure they don't negatively impact your performance.
- Third-party scripts pause the DOM construction, execute their code and then restart the DOM construction. You can prevent these delays by using the `async` or `defer` attribute in the `<script>` tags. “Async” downloads the script before stopping DOM construction, while “defer” downloads the script, but doesn't run it until the DOM construction is complete.
- Resources hints can help pre-fetch or pre-connect script DNS to reduce the time it takes to establish a connection. For example, you might use `<link rel="preconnect" href="https://cdn.example.com">` to lookup and resolve DNS before loading the script. These techniques are especially handy for CDNs that involve a lot of time verifying SSL certificates.
- Finally, self-hosting scripts is a great way to eliminate both time and risk. The time it takes to resolve a remote server, and the risk of issues if there are automatic updates to the script's API. You may also want to consider using a service worker to cache scripts that are hosted elsewhere to reduce the time it takes to load them.
The Bottom Line
JavaScript will only get more important in web and mobile applications. With audits and load tests, you’ll be more aware of the impact third-party scripts have on your website. It’ll help you take the right measures to optimize performance.
And LoadNinja makes it easy. Load test any web application, view actionable metrics, and quickly debug the problem scripts. In addition, LoadNinja easily integrates into your existing CI/CD tools, and can add load tests to your day-to-day Agile development process. Best of all, the real browser tests incorporate the impact of third-party scripts.
Sign up for a free trial
Get started today!