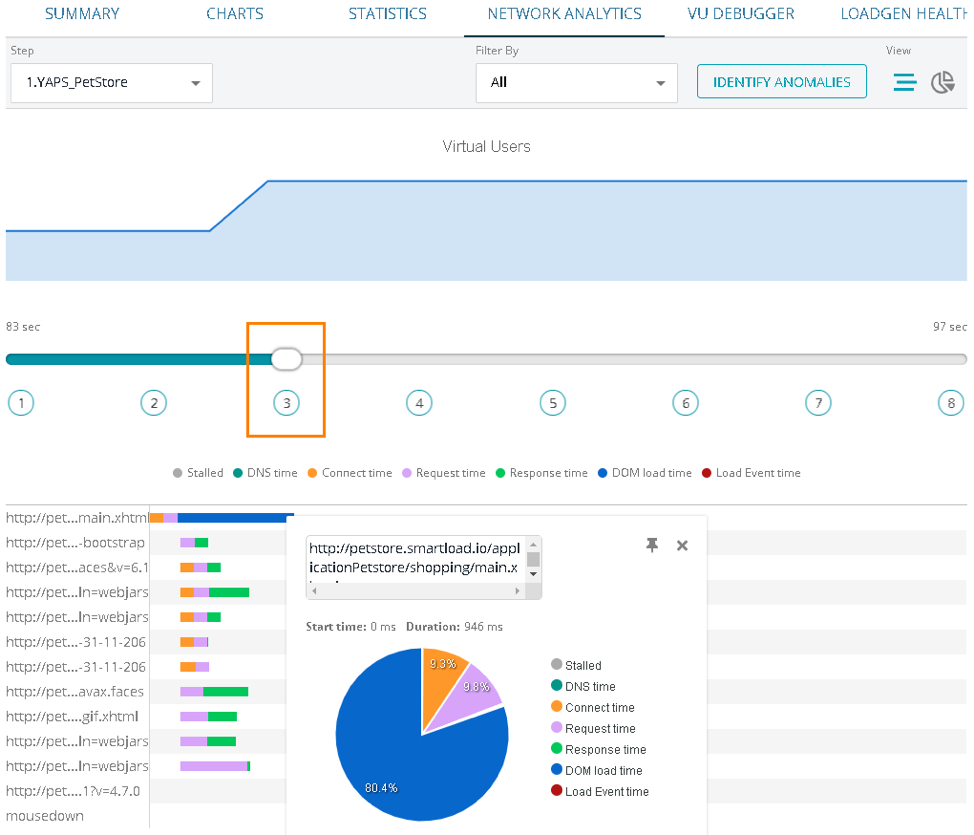
Network metrics aren't particularly useful without knowing what's abnormal and what's happening on the browser DOM level.
How Protocol-Based Load Testing Gets Tricky
You may already know this, but let’s cover the basics. Load testing is designed to show how an application performs under an expected load. For example, say you want to see if your ecommerce application can withstand holiday traffic without crashing. Even slowing down would impact the user experience and affect conversion rates. Since these tests are costly and time-consuming to run, they’re typically run on an infrequent basis before a major deploy or traffic spike and don’t relay accurate data.
Most load testing frameworks are protocol-based, which means they make requests to a server and evaluate the responses from the server. Since this is done without a browser, you can quickly send a lot of traffic to a given endpoint with relatively little cost and effort. The downside is that you can’t measure browser-related performance issues, such as HTML render time or JavaScript execution time.
Another challenge with most protocol-based load testing frameworks is writing dynamic load test scripts that involve sessions or cookies. Since there’s no browser involved in the process, it's necessary to generate and inject these dynamic variables into test scripts, which takes a long tim and is error prone. You should also build in think-time and other dynamic elements that aren't obvious (at the time).
The final challenge is actually diagnosing problems from load test data. With many platforms, developers have to comb through server and network logs to try and find abnormalities. Some bottlenecks may be obvious, but in most cases they take hours to find. Hours that could be spent building new features or troubleshooting other bugs.
Browser-Based Load Testing Network Metrics Go Deeper
Browser-based load testing platforms, such as LoadNinja, provide deeper network metrics that involve the browser. In addition to greater insight into the true user experience, these metrics make it easy for developers to diagnose bottlenecks. They can see how browser-related networking issues impact performance rather than just looking at vague protocol-level data, including things like DNS lookup times and DOM load times.
LoadNinja provides seven key network metrics:
- Stalled: The time the request spent waiting before it could be sent.
- DNS Time: The time spent performing a DNS lookup, that is, obtaining the IP address of the website from the DNS server.
- Connect Time: The time spent performing a TCP handshake, that is, establishing a connection to a web server after the DNS lookup.
- Request Time: The time it takes to send a request to the server and get a response from it.
- Response Time: The total time passed from the moment the client sent the composed request until the moment when the page's HTML was downloaded.
- DOM Load Time: The total time it took to load and construct the DOM – when the DOMContentLoaded event starts.
- Load Event Time: The total time it took to fully load the page, as well as all the resources it referred to, to the DOM – when the onLoad event is triggered.
All of these metrics can be visualized on a unified dashboard to make it easy to see trends over time. You can even filter the metrics to see what scripts, images or stylesheets have the biggest performance impact, as well as the load order of different URLs and links. These data points can help pinpoint problems by narrowing down different potential causes for bottlenecks in seconds rather than hours.
LoadNinja Automation Simulates Real-Life Think Time
LoadNinja makes it easy to automatically create scripts using its record and replay capabilities. Rather than writing scripts, you can record an actual browser session via a web-based interface. The tool automatically records each action and the think-time associated with it to create an extremely accurate load test that mimics actual user behavior – including network analytics that involve the browser.
Modern load testing frameworks also provide automated tools designed to help solve problems with minimal time and effort. For example, LoadNinja's Identify Anomalies feature leverages artificial intelligence to help find unusual load times without any effort on the part of a tester or developer. After you resolve the issue the first time, it remembers and offers the same solutions or similar problems in the future to cut down on troubleshooting time.

LoadNinja Network Analytics Tab – Source: LoadNinja
In addition to bottleneck identification, it's important to automate the process of running tests and generating reports. LoadNinja offers a Jenkins plugin that makes it simple to bring load tests into your continuous integration setup. You can even manage tests and reporting within Zephyr for Jira. There’s no need to spend hours trying to configure and maintain connections between various tools in your workflow.
Skip the Late-Night, Post-Deployment Race
Load testing is an integral part of the development process. By testing performance at different loads, you can spot bottlenecks before they cause real problems for real users. This way you can avoid the late-night race after you deploy, trying to debug issues before users find them.
LoadNinja is a load testing platform that makes it easy to build comprehensive load tests using record and replay capabilities. After building tests, you can use them on tens of thousands of real browsers and generate actionable metrics for developers to troubleshoot. They even include network analytics that many other load testing platforms miss. All of this can be easily incorporated into your CI/CD pipeline.
Request a Demo
See how easy it is to start load testing your application