Google Chrome DevTools
Google Chrome’s DevTools is one of the best ways to measure JavaScript performance and debug any bottlenecks.
You can open DevTools by running Google Chrome and then pressing Command+Option+I (Mac) or Control+Shift+I (Windows & Linux), or even just right-click and select Inspect.
Start by recording runtime performance:
- Open DevTools and click on the Performance tab.
- Click the Record button to start recording runtime performance.
- Wait as DevTools profiles the page.
- Click Stop to stop recording, process the data and display results.

Chrome DevTools Performance Reports – Source: Google
Note: You can throttle Network or CPU resources in the top section of the Performance Tab. For instance, you may want to set CPU to “2x slowdown” to mimic a mobile device if you’re on a high-powered laptop. You can also throttle network speed to simulate mobile networks.
There are a couple of key metrics to watch:
- FPS Chart: The Frames per Second (FPS) chart shows the performance of animations and should generally be 60 FPS. When the framerate drops below acceptable levels, you’ll see a red bar rather than a green bar.
- CPU Chart: The CPU chart shows the browser’s CPU usage. If you’re maxing out a browser’s CPU, find ways to cut down on the amount of work necessary because you could be slowing down the user’s device.
If you’re seeing a laggy UI or excessive CPU usage, you can debug performance issues in the Main section under the Performance tab. The flame chart shows activity on the main CPU thread over time, where the X-Axis is time and the Y-Axis is the call stack. If you click on a particular call, you can see how long it took to execute.
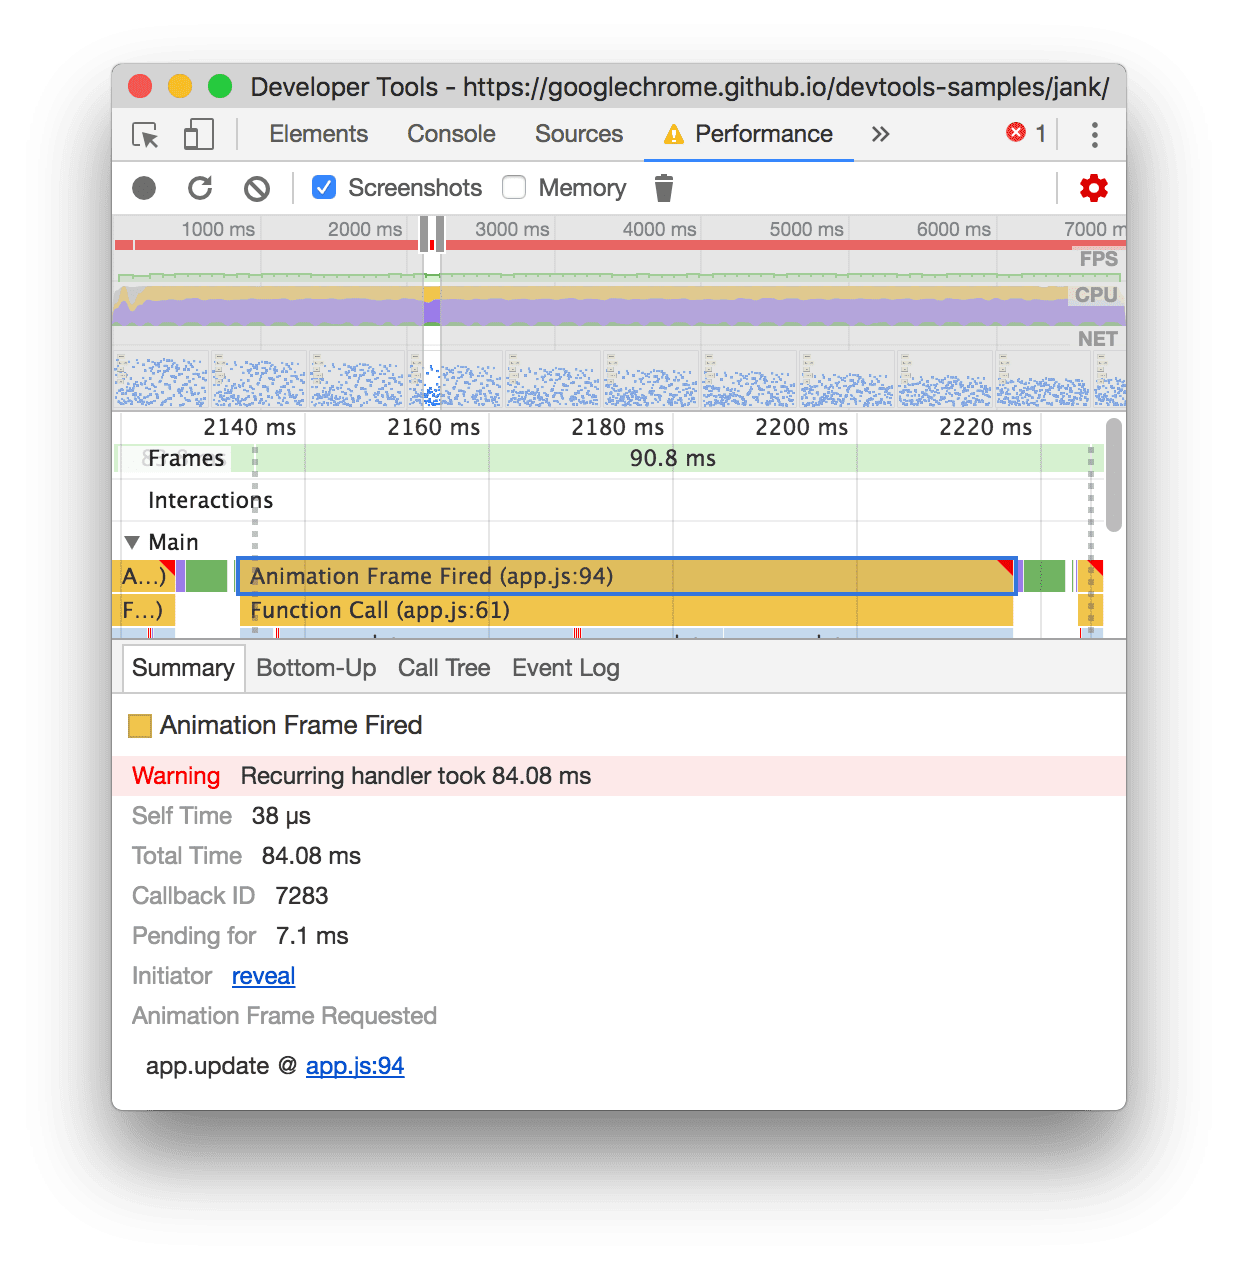
Chrome DevTools Script Overview – Source: Google
You can go to the exact line of JavaScript code causing an issue by clicking on the relevant file at the bottom of the Summary tab. From there, you may want to look for ways to make the line of code more efficient to reduce the impact on page load.
Browser-Based Load Testing
Most load testing solutions are protocol-based platforms, which means that they only test server endpoints. They send a request to a server endpoint and measure the response time and other performance metrics. Of course, these tests fail to account for the time it takes a browser to load JavaScript, CSS, images and other assets.
Browser-based load tests overcome these issues by spinning up actual browser instances and measuring how long it takes them to fully render a response. By measuring the time between the request and the final render, you have a much clearer picture of the user experience – especially for JavaScript-heavy apps.
LoadNinja makes it easy to develop browser-based tests to measure JavaScript performance and identify bottlenecks.
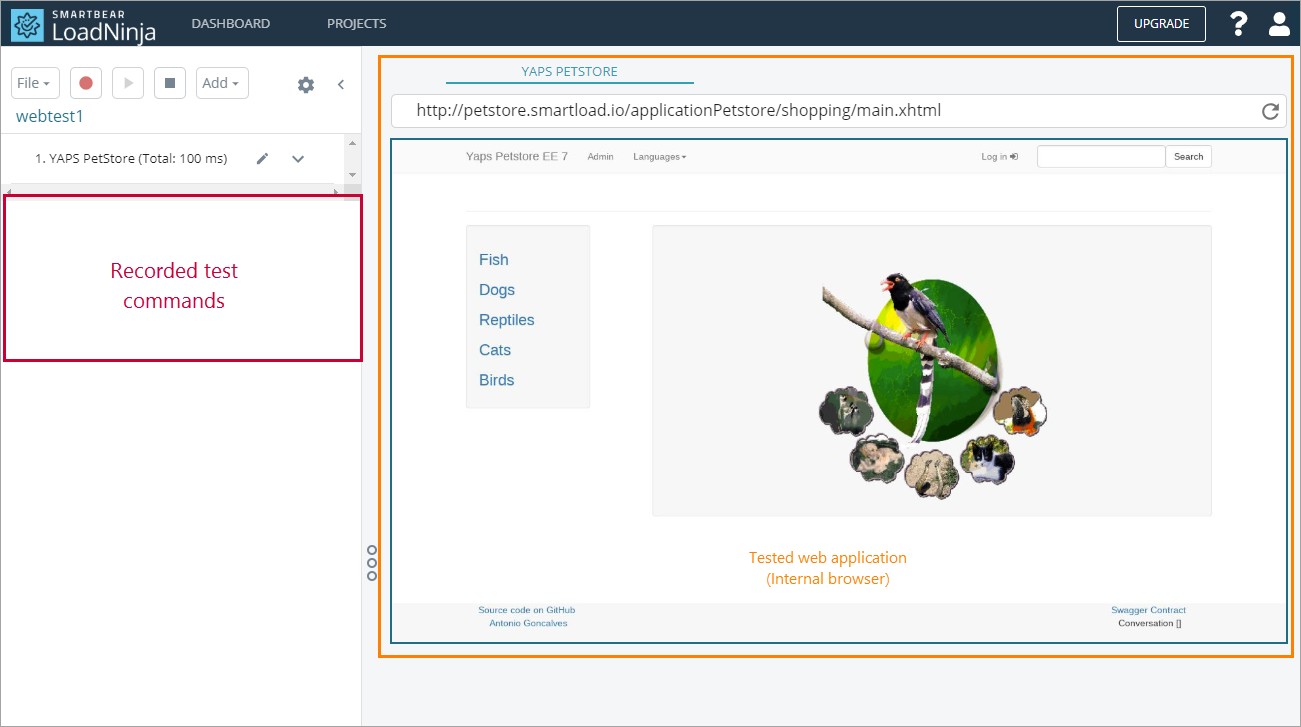
LoadNinja Record and Replay Capabilities – Source: LoadNinja Documentation
Start by recording a new load test:
- In a project, click Create Test and select UI Test.
- Input the URL and desired screen resolution and click Start Recording.
- Run through the user workflow that you want to test.
- Click Stop to stop the recording.
- Edit any steps or add Assertions in the Step Editor pane.
- Click Save and Run Load Test.

LoadNinja Reporting – Source: LoadNinja Documentation
The Test Results page shows a variety of metrics on each tab:
- Summary: Shows a basic summary of the test results.
- Charts: Shows duration, navigation timing, and other metrics in a visual format that lets you easily spot anomalies.
- Statistics: Shows you the results of each individual script, with metrics like durations and standard deviations.
- VU Debugger: See errors that occurred on the virtual user machines, and even access the actual remote console.
- VU Inspector: View desktops of remote cloud machines where virtual users are working.
In addition to avoiding the need to write test scripts, LoadNinja also provides a machine-learning assistant called Sensei that looks through various data and identifies performance issues based on trends over time. The tool then suggests ideas to fix these issues in your application, letting you focus more on improvements.
How to Choose the Best Load Testing Approach for Your Organization
Putting the Pieces Together
The best way to avoid JavaScript performance issues is to encourage developers to use Google Chrome’s DevTools (or similar solutions) to profile and optimize JavaScript during development. Keep performance in mind and you can avoid a lot of issues from occurring in the first place.
While this can help avoid problems, it’s never going to be a perfect solution that catches every issue. Load testing is the only way to catch performance bottlenecks that slip through the cracks before they’re deployed to production – but only if run as part of a continuous integration (CI) workflow.
The combination of profiling, optimization, and load testing is the best way to maximize performance and eliminate bottlenecks. In addition to improving the user experience, these efforts can help you meet service level agreement (SLA) requirements and other business requirements.
Flip the ‘Script
JavaScript has become the de-facto programming language for the web, but with processing moving to the client side, it’s easy to miss performance issues. By profiling and optimizing JavaScript during development, developers can avoid many of them before they become a problem. But it’s always a good idea to load test to ensure quality as well.
If you’re interested in a browser-based load testing solution, try LoadNinja today to see how easy it is to get started. It’s easier than you think to deliver a better user experience.
Try LoadNinja today
See how easy it is to get started and deliver a better user experience