Poor User Experience
The most obvious sign of performance issues is from long loading times. If your website takes more than two seconds to load, that’s considered a poor user experience. Nearly half of internet users will abandon a website that takes longer than three seconds to load!
You can detect these types of performance problems by running load tests that simulate production-level traffic on your development-stage applications. By identifying issues before deployment, you can fix bottlenecks before they're ever experienced by production users.
It's worth noting that there are two types of load tests:
- Protocol-based load tests are ideal for testing APIs that may be causing poor performance on applications that are consuming them, including single-page applications, mobile applications, or even Internet-of-Things applications.
- Browser-based load tests are ideal for testing web applications that have a heavy client-side component. After all, protocol-based tests won't tell you if bloated JavaScript code or outright errors are causing performance issues independent of the API endpoints.
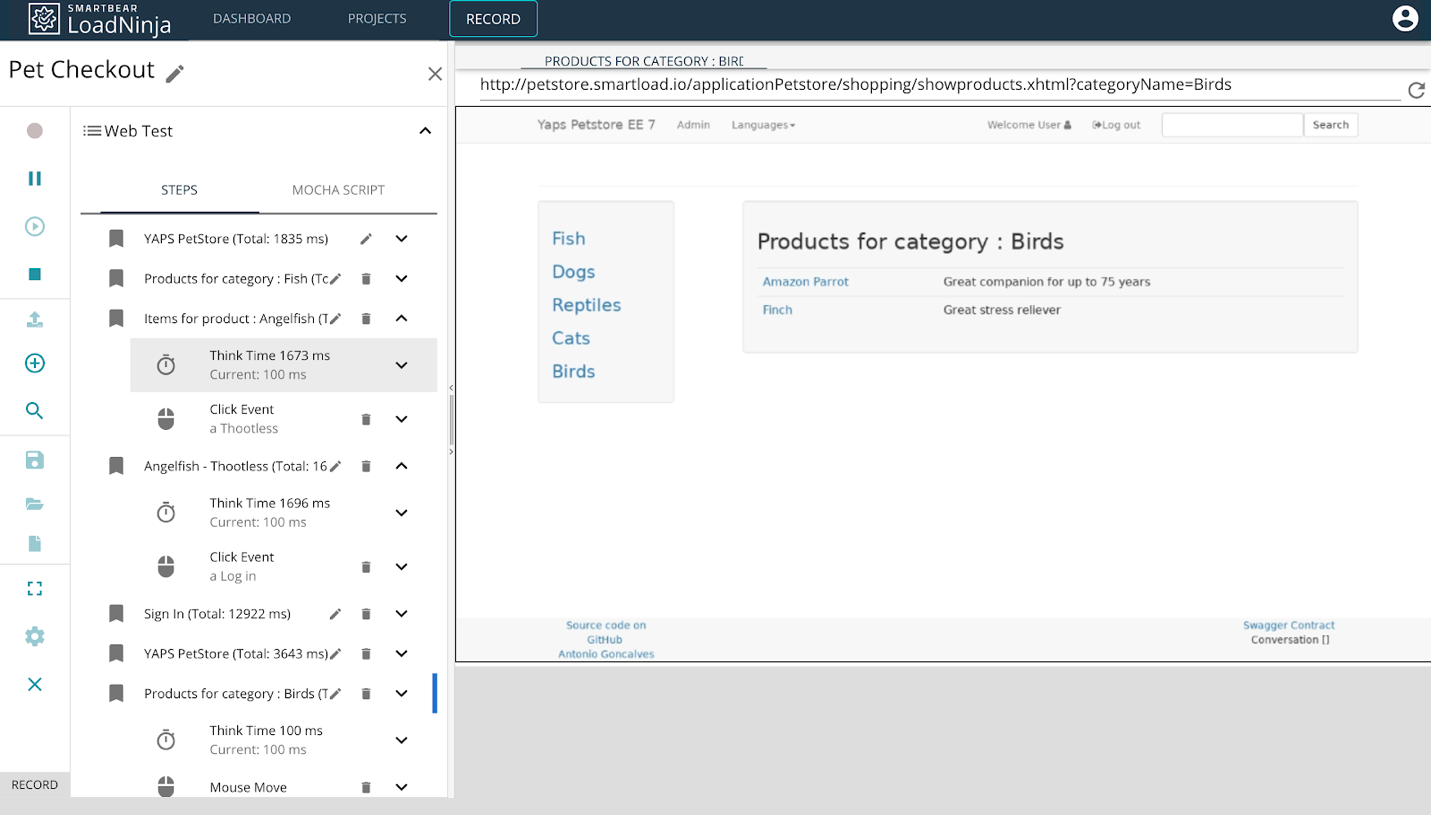
LoadNinja Easy to Use Recorder – Source: LoadNinja
LoadNinja provides one of the best load testing tools in the market with support for both API and UI load tests. Anyone can easily record a test in a browser instance, incorporate dynamic data, and deploy the load tests into continuous integration processes to ensure they're consistently run.
Excessive Resource Usage
The sneakiest sign of performance issues arise from inefficient scripts that consume a lot of resources. Many businesses are tempted to throw more resources at slow performance as a short-term fix without addressing the underlying issues, which leads to high costs.
Even worse, you may have infrastructure that automatically scales based on application load. The cost of these resources can quickly spiral out of control, then you could face a surprise bill at the end of the month from your cloud services provider.
You can identify excessive resource usage through a number of tools. For example, if you're using AWS for your infrastructure, you can use AWS Cost Explorer and AWS Budgets to track cost trends and alert you when costs spike beyond the average range or a particular level.
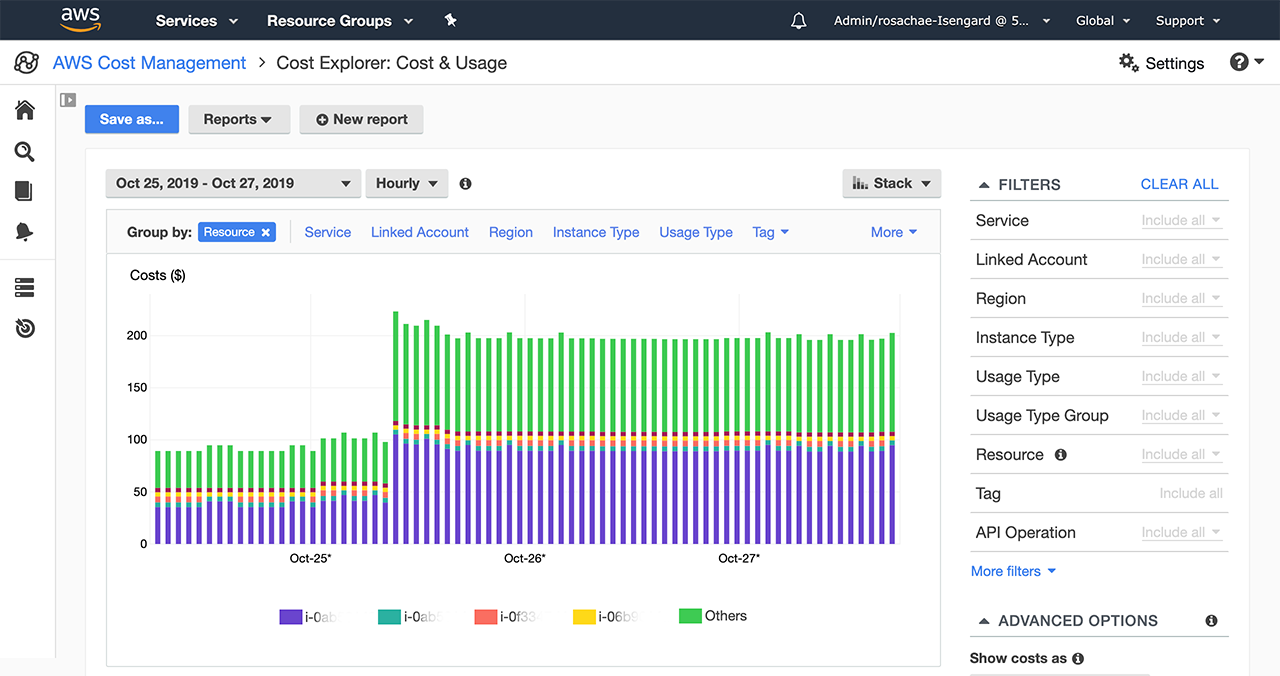
AWS Cost Explorer - Source: AWS
Unfortunately, resource usage is a lagging performance indicator, so by the time you see it, it's usually too late. That's why it's best to monitor for bottlenecks using load testing frameworks rather than waiting until a large bill is on your desk.
Low Search Rankings
Search engine algorithms have evolved from looking purely at backlinks to looking at a complex web of factors. Beginning in July 2018, Google began using page speed as a ranking factor in search results. Slow websites are penalized; faster websites get rewarded.
The performance issues impacting search rankings aren't always obvious. For example, website performance may look great on a fast fiber internet connection, but the mobile experience on a cellular network might be a lot slower. Search engines look at all of these factors when ranking per device.
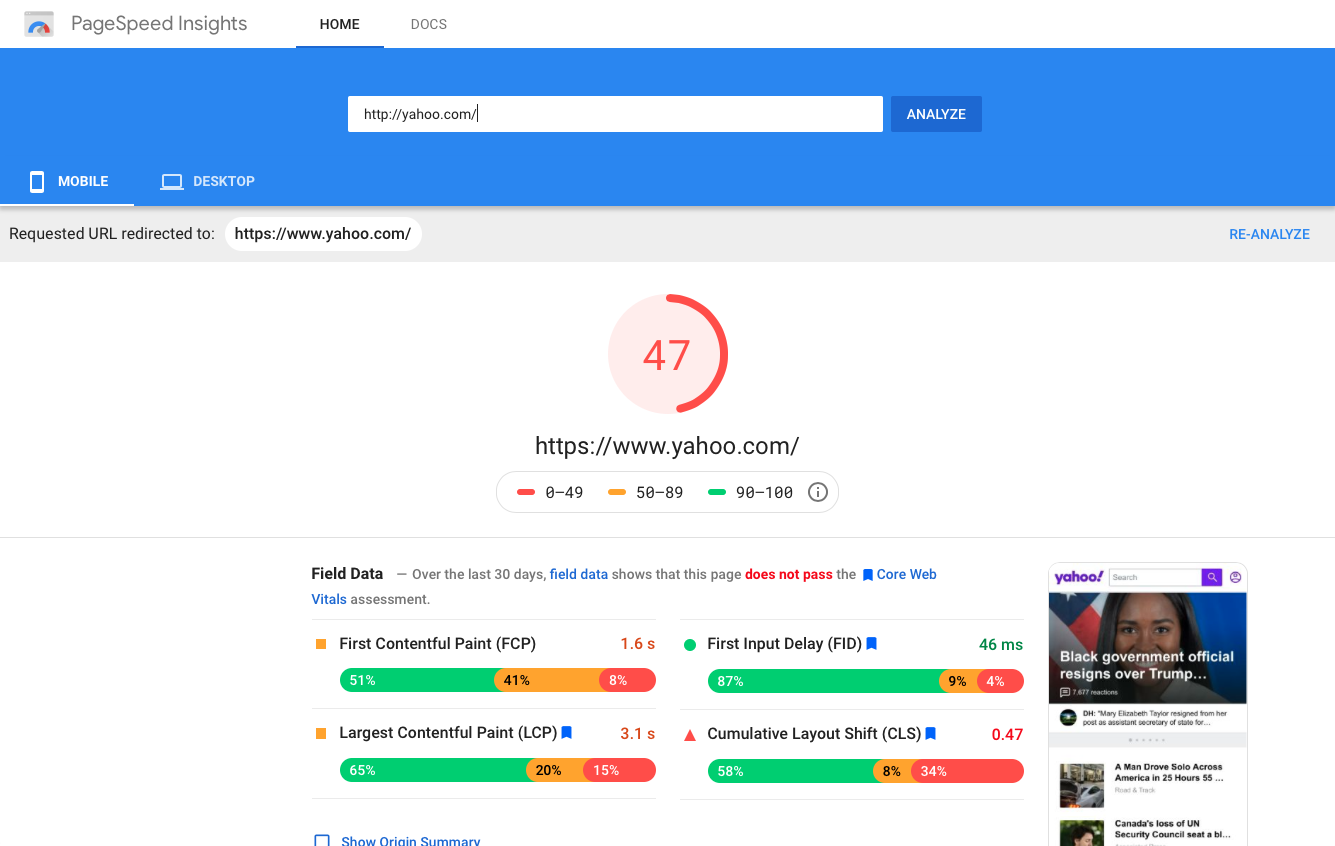
Google PageSpeed Insights – Source: Google
The good news is that Google's PageSpeed Insights tool can help you automatically identify these performance issues across devices, and even get recommendations to fix them. It's a good idea to regularly run checks on your web applications if you're concerned with SEO rankings (e.g. non-internal).
Best Practices to Remember
Performance testing is a critical component of software development. The best way to check for problems is test before each deployment and monitor for resource or cost anomalies.
Here are some best practices to keep in mind:
- Regularly Load Test: Load testing is the best way to identify performance bottlenecks before they reach production users. If you catch them early on, you don't have to worry about those problems down the road.
- Monitor Cloud Costs: Set up cost monitoring for cloud services to quickly identify performance-related cost increases. That way you won't have to wait until the end of the month to see if there’s a problem – and a surprise bill.
- Monitor Performance: Should be a regular part of software development requirements. For instance, developers should be aware of load times when writing code, and before load testing comes into play.
It’s Not Always a Dramatic App Failure
Performance issues aren't always as obvious as an application going down during a traffic spike. Some performance issues are more likely a leaky faucet – they cost you a little bit extra every month, steadily get worse over time, and eventually burst into a much larger problem.
By keeping the best practices that we’ve discussed in mind, you can catch performance issues before they become bigger issues. The key is building these practices into your existing Agile development workflows to ensure they get done.
Load testing is the best way to proactively identify and fix performance issues. Especially when the tests are run as part of continuous integration and continuous delivery workflow.
If you're looking for a load testing solution
Try LoadNinja for free and see how easy it is to get started!