Load tests have been historically difficult to record, playback and analyze, but LoadNinja makes the process easy enough to integrate into your Agile workflow.
What is Load Testing?
Load tests are production simulations that enable development teams to measure response times, throughput rates, and resource utilization levels to identify performance bottlenecks. While functional tests ensure that an application works, load tests ensure that it will work in production, which means that developers can confidently deploy changes.
There are four steps to start load testing:
- Collect Requirements - Determine the most critical functionalities that shape the end user experience.
- Map Out User Journeys - Determine how users interact with the application using monitoring data from APM tools.
- Establish a Baseline - Determine the current performance and use that as a benchmark for improvements.
- Automate & Integrate - Prioritize load testing within the continuous integration and deployment process.
Unfortunately, load testing is a complex and costly process that's typically outsourced to third parties to run on an infrequent basis. The good news is that new tools, like LoadNinja, make it easier to record and playback load tests in minutes rather than days. The platform also makes it easier for developers to dig in and address any bottlenecks.
Recording & Translating Scripts
Conventional load testing involves writing complex scripts that mimic browser requests. For example, a developer might open Chrome Developer Tools, analyze the Network tab for data flow, and translate each line item into a script. Dynamic variables, such as sessions or cookies, must be mocked in order to make the load test correctly function.
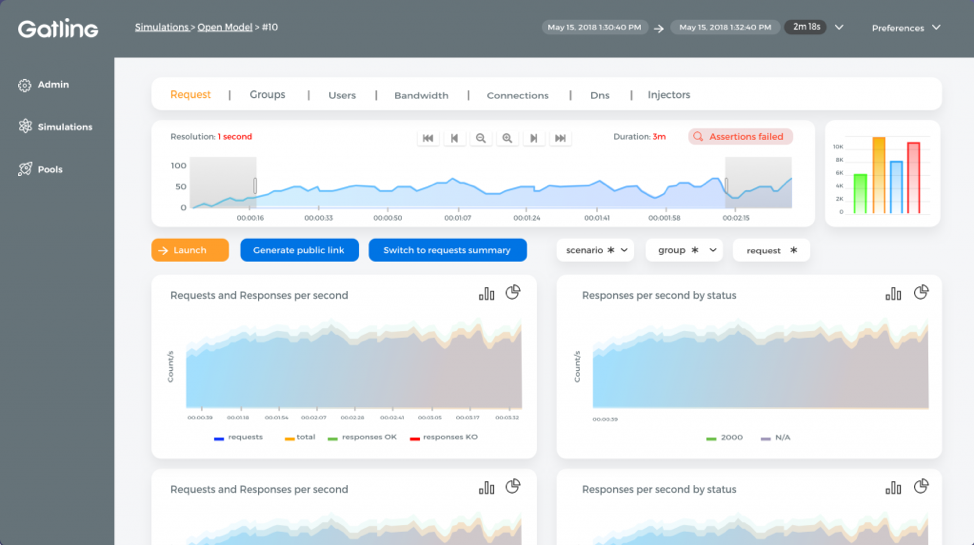
Gatling Reporting Interface
JMeter and Gatling were developed to simplify this process using two different approaches:
- JMeter provides a user interface for recording and replaying load tests, as well as generating basic reports. While it's an improvement over scripting, the user interface is complex and there's a steep learning curve to getting setup.
- Gatling provides an easier way to write load tests with code that abstracts many common requirements, such as creating headers, and provides a beautiful dashboard. The problem is that it's not very approachable for non-coders.
Simple load tests are relatively straightforward to build, even with simple scripting, but they can quickly become complex. With modern applications becoming front-end heavy, these challenges can make load testing nearly impossible for internal development teams that are already under pressure, which in turn makes it impossible to be part of an Agile workflow.
Some of the biggest challenges include:
- HTTPS tests might require users to import certificates to a computer's root, which can put the device at risk for security vulnerabilities and other issues.
- Capturing client-side changes that don't interact with the server, such as single page applications (SPAs), can be extremely tedious and time-consuming.
- Playing back scripts with dynamic correlation, such as sessions and cookies, can take several hours or days since there's a lot of preparation that needs to be done.
Running Tests & Accessing Reports
Recording and translating scripts is only half of the challenge associated with load tests.
Protocol-based load tests may be a quick-and-dirty way to get performance data, but they don't necessarily emulate the true user experience since they don't render HTML or execute JavaScript. They are especially problematic in SPAs and other JavaScript heavy applications where protocol traffic is minimal compared to the front-end processing.
When troubleshooting bottlenecks, protocol-based error messages aren't particularly helpful for developers that are used to working in the Document Object Model (DOM). A single API route could be hit from many different sources and it takes time to track down the culprit.
Browser-based load tests provide much more realistic results, but they involve spinning up real browsers. Since each browser requires a CPU core, it's very expensive to setup cloud-based load generators that spin up browsers to run tests. And, it's not practical to setup these kinds of tests in-house given the high cost of hardware compared to cloud-based assets.
Even if you have browser-based load test results in hand, it's challenging to decipher them without the right reporting tools. Developers need to identify the exact virtual user that experienced the issue and dig into their browser history to identify the bottleneck using DOM tools.
How LoadNinja Can Help
LoadNinja makes it easy to record and instantly playback load tests scripts in the browser without the need for dynamic correlation. Since it's a cloud-based platform, you don't have to download additional tools to record a test, which makes it easier to use than tools like JMeter that require a proxy.
There are a few simple steps to get started:
- Create a New Project.
- Click Record.
- Specify a URL and Screen Resolution.
- Click Start Recording.
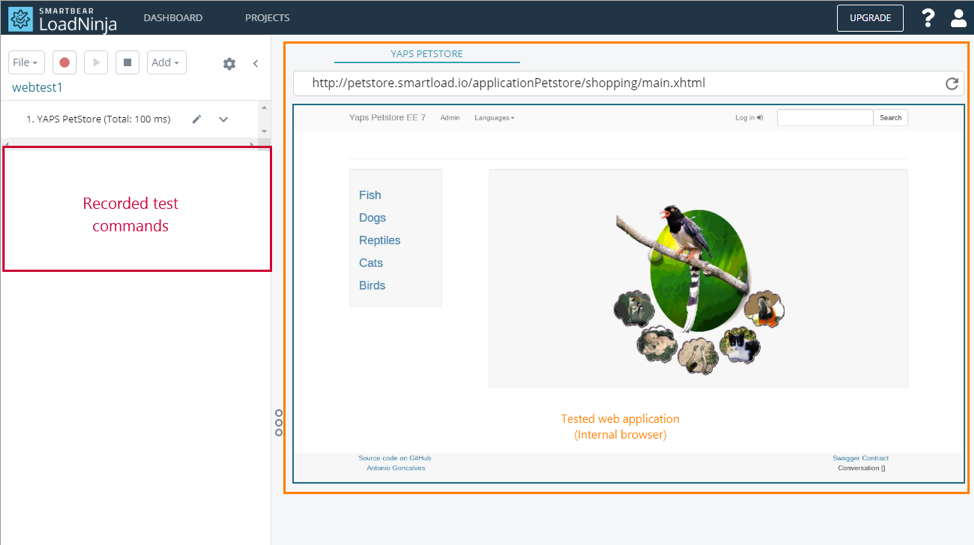
LoadNinja Record and Playback Interface
You can then interact with the application as you normally would in the right panel and see all of the recorded test commands in the left panel. In addition, you can edit any of the steps to add validations, pull dynamic data from a data bank, or add URLs to block (e.g. external API calls).
Click the Stop button to stop the recording and then the Save and Run Load Test button to run the test. You can then use the VU Debugger to dig into specific browser sessions or look at high-level reporting that shows charts and statistics for response times, error/success rates and other information.
In addition to creating load tests, LoadNinja makes it easy to run browser-based tests that are scalable to tens of thousands of browsers at a much lower cost than using cloud servers. You can quickly add concurrent virtual users, configure test duration, playback time, and more with a few clicks.
LoadNinja also provides real browser-based results that mimic what end users will experience, broken down by granular navigation timings. When developers need to troubleshoot a bottleneck, they can log in to the specific virtual user browser session and access the browser via a DOM to find the culprit.
The Bottom Line
Load testing is the only way to ensure that performance bottlenecks don't cause issues in production. Unfortunately, conventional load tests are very difficult to create and maintain over time — especially for modern applications. The good news is that new tools, like LoadNinja, can help simplify testing and make it possible to add to Agile workflows.
Sign up for a free trial
See how easy it is to get started with LoadNinja in your business